Investors Cheer the Fed’s Rate Cut
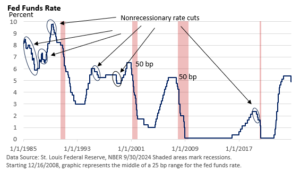
The Federal Reserve implemented a significant policy shift last month with a larger-than-expected 50 basis point (bp, 1 bp = 0.01%) rate cut to 4.75 – 5.00%. This is the first time the Fed has begun with a 50 bp rate reduction since the rate cuts that preceded recessions in 2001 and 2007.

We’re not implying that a more aggressive 50-bp approach signals the economy is approaching a recession. But the Fed appears to be sending a message that it may be a little more willing to tolerate slightly higher inflation as it shifts its focus away from inflation and turns its gaze towards the labor market and employment.
First, let’s look at why the Fed could have arguably settled for a more measured 25 bp rate cut.
- The economy is on a firm footing—the Atlanta Fed’s GDPNow model was tracking a solid 3.1% annualized pace for Q3 GDP as of 9/27/24. Q3 GDP will be released in late October.
- The consumer is resilient.
- Layoffs measured by first-time claims for unemployment insurance are low.
- Job openings are down but remain elevated.
- Inflation remains above the Fed’s 2% target.
- A 50 bp rate cut is an admission the Fed waited too long to cut interest rates.
- Reducing rates too quickly could reignite inflation.
Next, let’s review the reasons why the Fed could (and did) opt for 50 bp.
- Cracks are appearing in the labor market.
- The jobless rate has risen from its cyclical low, employment growth has slowed, job openings are down from extremely high levels, and more recently, employment growth has been concentrated in state/local government jobs and health care (U.S. BLS).
- The Fed may have waited too long to start reducing rates.
- A slowing rate of inflation, coupled with a stable fed funds rate over the last 13 months, implies the inflation-adjusted fed funds rate has risen to a level that may be too restrictive.
- Waiting until economic growth stalls before implementing aggressive rate cuts would probably be too late to prevent a recession.
Notably, Fed Chief Jerome Powell was quick to point out that the “economy is in good shape,” but he also acknowledged that employment growth has slowed. He added, “There is thinking that the time to support the labor market is when it’s strong and not when we begin to see layoffs.”
Investor reaction
Let’s review an abbreviated version of last month’s graphic. Historically, stocks have had a good run when rate cuts are accompanied by modest economic growth.
That was not the case in 2001 and 2007 when rate cuts failed to avert a recession.

Using the data in the table above, the average increase in the S&P 500 Index one year after the first rate cut was 7.17%. Excluding recessions, the average rise for the S&P 500 Index one year after the initial rate cut was 16.86%. In 2001 and 2007, when the economy fell into a recession, the average selloff in the S&P 500 was 17.07% one year after the first rate cut.
Lower interest rates provide less competition for stocks when the economy expands, while rising corporate profits also support equities. It’s a two-fold tailwind.
However, when the economy sank into a recession in 2001 and 2007, multiple rate cuts failed to lift stocks, as investors lamented the decline in corporate profits.
How far might the Fed reduce the fed funds rate? Well, any forecasts are just that: forecasts, and forecasts don’t always pan out.
In the last three cycles (1995, 1998, and 2019) when a recession was avoided (a non-economic event sparked the 2020 recession), we saw three 25 bp rate cuts. They were modest and helped support the economic expansion.
Today, the Fed is projecting a more aggressive reduction in rates through the end of 2025, one that could bring the fed funds rate to nearly 3%, based on its Quarterly Economic Projections.
Much, however, will depend on how the economic outlook evolves.
Early read
Stocks rallied as investors took Powell at his word that the outsized Fed rate cut wasn’t in response to a deteriorating economic outlook.
Notably, after an uncertain start at the beginning of August, investors pushed shares higher in what has historically been the year’s weakest period.
This year, August and September were positive months, with the S&P 500 racking up the best cumulative August-September advance since 2012, according to S&P 500 data provided by the St. Louis Federal Reserve.
Final thoughts
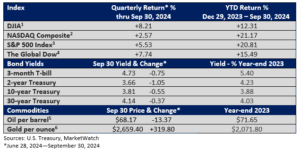
The Dow Jones Industrial Average and the S&P 500 Index ended the quarter at record highs amid moderating inflation, modest economic growth, profit growth, and falling interest rates.
Though short-term issues could heighten volatility, that favorable economic backdrop remains as we enter the fourth quarter.
With this in mind, robust market performance can sometimes lead to a euphoria that may encourage too much risk-taking. We caution against that.

Overweighting stocks may support returns, but unexpected volatility from any number of sources can spark shorter-term declines that go beyond one’s comfort level.

