Inflation Makes a Play, Investors Ignore
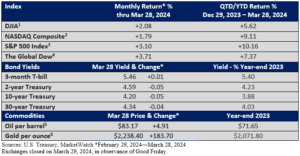
There was a brief pause as the new year began, but for all practical purposes, markets put on quite a show in the first quarter of 2024, with the Dow, the Nasdaq Composite, and the S&P 500 Index setting multiple records.
During the quarter, the broad-based S&P 500 Index notched 22 closing highs, and the Dow recorded 17, according to Dow Jones Newswires. The Nasdaq posted four new highs.
A recent story re-printed in Morningstar on March 25th summed it up nicely.
“A record stock-market rally has caught many of Wall Street’s top strategists flat-footed. Now, they’re racing to catch up, updating their year-end S&P 500 targets…At least six Wall Street banks have lifted their S&P 500 targets over the past two months.”
We won’t offer an opinion on the market over the next few months. There are too many unknowns. While top market strategists are bright individuals and provide keen insights, they have tripped on their forecasts before.
Catalysts
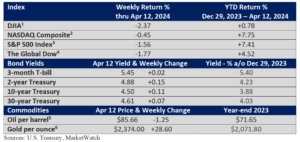
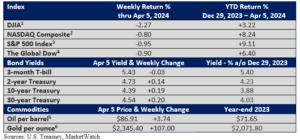
As the year began, a key gauge from the CME Group suggested the Federal Reserve was gearing up to cut interest the fed funds rate by 1.50 – 1.75 percentage points this year, likely in a series of six or seven 25 basis-point (bp, 1 bp =0.01%) rate reductions.
Pushback from Fed officials, who are projecting three 25 bp rate cuts this year, and unexpectedly sticky inflation early in the year have forced investors to reduce rate-cut expectations by half. Notably, longer-term Treasury yields have edged up since early January.
But that hasn’t blunted the market’s advance.
That leads to an important catalyst. There are few signs that a profit-killing recession is on the horizon. Investors seem more smitten by rising earnings and steady economic growth right now.
Moreover, the enthusiasm for AI has yet to abate.
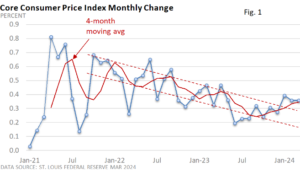
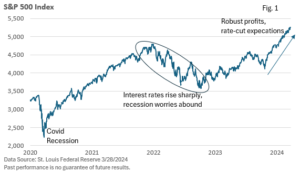
Still, reassurances from the Fed that recent sticky inflation had not yet changed its plan for three interest rate cuts this year have aided sentiment (Figure 1).
Notably, volatility has been minimal.
No matter how small, Figure 2 measures the pullback (drawdown) from each peak-to-trough in the S&P 500 since its bear market low in October 2022.
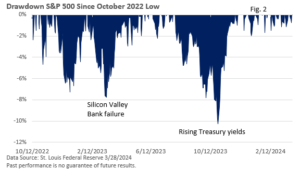
Since the S&P’s 10% correction in the second half of 2023, market volatility has been unusually low, as illustrated in Figure 2. The S&P 500 has gained 27.6% since that 10/27/2023 low.
It’s up 46.9% since the bear market bottomed in October 2022 (both returns exclude dividends reinvested; both through 3/28/2024).
A decline of at least 10% in any given year isn’t unusual. Since 1980, the average annual maximum drawdown for the S&P 500 Index has been 14%, according to S&P DJ Indices and LPL Research.
Maximum-annual drawdowns (peak-to-trough) have ranged from 2.5% in 1995 to 48% in 2008. In 21 instances since 1980, the pullback has been less than 10%.
Euphoria leads to complacency?
Robust market performance can lead to excessive risk-taking and complacency. The economic fundamentals are strong, and the Fed seems intent on reducing interest rates this year. Both have historically been favorable for stocks.
What could go wrong?
Market corrections rarely occur in a vacuum. Stocks don’t go on sale “just because.” Yet, long-term disciplined investors won’t discount the possibility of a decline.
What might create market volatility? Unexpectedly bad economic news could jar markets.
Fed officials believe the recent uptick in inflation is temporary and can be tied to the calendar, i.e., price hikes near the beginning of the year.
However, what if the recent sticky inflation numbers prove to be more than a temporary setback? Well, the Fed could delay rate cuts.
We are also mindful that an unwanted surprise could encourage short-term traders to take profits. A year ago, Silicon Valley Bank unexpectedly failed, temporarily forcing stocks lower.
When stocks appear priced for perfection, any disappointment can encourage some selling.
With all that said, as we enter the second quarter, economic conditions that created a fertile ground for bullish sentiment remain in place.
Investors who have maintained a well-diversified portfolio and adhered to a disciplined approach have participated in the market’s advance over the past year.